Reports
Last updated: 2016-01-05
Sugester is equipped with powerful reporting tools. You're always just a few clicks away from comprehensive, visualized information about the life of your company. In this article we will go over all the available types of reports, explaning how to access and read them.
There are five types of reports available in Sugester:
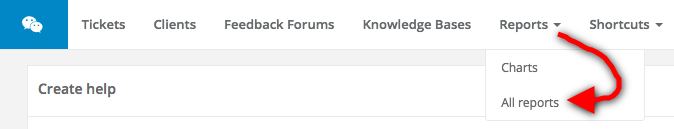
To access your reports from any place in the system, click Reports > All reports on the top pane.
These are the icons for each kind of report available:
-
Charts
Charts generated by Sugester can display information about tickets (e-mails, tasks, forum posts, knowledge base articles) or removed tickets (messages manually marked as spam, automatically detected spam and other removed items). Each of these groups can be hidden by clicking on its name at the bottom of the chart. You can also select start and end dates for the report. Finally, you can pick a grouping interval for the data points: they can be grouped by day, week, month, quarter or year

-
Number of tasks
The number of tasks report shows you a tabled view of how many tasks of each kind (these currently include 'unread', 'open', 'open customer submissions', 'open and waiting') are currently assigned to each user. This lets you quickly assess if the workload is fairly divided between your team members. The total number of each kind of tasks is displayed at the bottom of its respective tables.

-
Projects
The Projects tab lets you see how many tasks are left to complete in a particular project and its sub-categories. The same screen also shows how many tasks in the system haven't yet been assigned to a team member.

-
Timesheets
The timesheet report is a robust tool allowing you to manage and track the progress of a workday in your company. With just a few clicks you can find out:
- How much time did a team member spend on a particular project on a particular day
- How many hours did your team spend assisting a particular customer
and much more. You can also freely select the report's timeframe.
In the bottom part of the screen you can see three values total hours (the sum of all logged hours which fit your criteria), projects (the sum of all logged hours which fit your criteria, listed per project) and clients (the sum of all loged hours which fit your criteria, listed per client).
In the top right corner of the screen you can see a button marked Add hours. The button opens a prompt allowing you to complete the timesheet for a particular day. The prompt has spaces for such data as name, duration, date, project, customer and description of the task you're submitting.

On the right-hand side of the screen you can see a list of all activities, sorted chronologically - from the ones earliest in the day, to the ones which happened the latest. Each activity is accompanied by information about the date and time it took place as well as its kind (eg. e-mail, forum post) and title (if applicable). You can learn more about activites from the next section - read about the Activities Report.

-
Task timer
Apart from the automated time tracking features mentioned before, Sugester also gives you the option to track time 'manually'. This feature is especially useful if you bill your customers by the hour. Our timer makes figuring how much time was spent on each task, project or customer a breeze. You can acces the timer by:
- Going to Shortcuts > Track time on the top pane,

- or click the 'track time' option next to a task in your
inbox.

Clicking any of these options will send you to the time tracking screen:

The panel lets you choose a number from which to start counting (for example 1 hour and 5 minutes), so that you can easily fix your mistake if you forgot to start tracking earlier. You can also choose which client and project the time tracking entry will be assigned to. After filling out all details just click Save to activate the timer. Its value will be displayed next to your login and in the title of your Sugester browser tab, like so:

All of these are collected in the timesheet.
- Going to Shortcuts > Track time on the top pane,
-
Activities
The activities report gives you an overview of all user actions within Sugester. Each activity is described by 7 parameters: time, type, delay, user login, status, name, person responsible and project.
Activities can be synced with GitHub - see this article to learn how.

Back
Add Comment